Image Representation in MATLAB – How to Represent Binary,Grayscale & Color Images
In this article, we are going to talk
about images, their types and some basic functions for Images. This
article is part of our MATLAB tutorial series, which
we are developing for Image processing through MATLAB. We expect you to
give us feedback, so that we can keep the information flow more
efficient, informative and up to the mark. In the first chapter, you
have learned an introduction to MATLAB and its commands.
In this chapter you will learn how to represent different types of
images in MATLAB. In addition you will learn how to read & display
images in MATLAB and how to create an M file.
Taking Up Images
Technically whatever we categorize as a picture, is an Image. We already talked about the basics of Image processing in our first article, we would focus today on technical representation of images.Different Types of Images
Binary Image: An
image that consists of only black and white pixels. Technically these
types of images are called as Black and White Image. (Although it makes
me sad to break my reader’s heart but till now what you called black and
white images have some other technical name).
Grayscale Image: In
daily language what we refer to as black-and-white (as in old
photos) are actually grayscale. It contains intensity values ranging
from a minimum (depicting absolute black) to a maximum (depicting
absolute white) and in between varying shades of gray. Typically, this
range is between 0 and 255.
Color Image:
We all have seen this! Such an image is composed of the three primary
colors, Red, Green and Blue, hence also called an RGB image.
RGB value:
All colors which we see around us can be made by adding
red, blue and green components in varying proportions. Hence, any
color of the world can uniquely be described by its RGB value, which
stands for Red, Blue and Green values. This triplet has each value
ranging from 0 to 255, with 0 obviously meaning no component of
that particular color and 255 meaning full component. For example,
pure red color has RGB value [255 0 0], pure white has [255 255 255],
pure black has [0 0 0] and  has RGB value [55 162 170].
Representation of an Image in MATLAB
An image in MATLAB is stored as a 2D
matrix (of size mxn) where each element of the matrix represents the
intensity of light/color of that particular pixel. Hence, for a binary
image, the value of each element of the matrix is either 0 or 1 and for a
grayscale image each value lies between 0 and 255. A color image is
stored as an mxnx3 matrix where each element is the RGB value of that
particular pixel (hence it’s a 3D matrix). You can consider it as three
2D matrices for red, green and blue intensities.
Reading and Displaying Images
imread(): To read an image and store in a matrix.
Syntax: IM=imread(‘filename’)
where IM is a matrix. If the file is in
the current directory (as described above), then you only need to write
the filename, else you need to write the complete path. Filename should
be with extension (.jpg, .bmp,..). There are some default images of
MATLAB like ‘peppers.png’, ‘cameraman.tif’, etc. You can try reading
them as
>>im=imread(‘peppers.png’);
It is always advised to use a
semi-colon (;) at the end of the statement of reading an image,
otherwise… you can try yourself what happens!
imshow(): Displays the image. Syntax:
imshow(‘filename’)
or imshow(im)
Example:-
>>imshow(‘cameraman.tif’);OK, now let’s make our own image, try this:
>>a(1,1)=0;
>>for i=1:200; for j=1:200
a(i+1,j+1)=1-a(i,j);
end end
>>imshow(a);
You try out making many different types of images like this just to make yourself comfortable with the commands learnt till now.
Data cursor: To see the
values of the colors in the figure window, go to Tools>Data Cursor
(or select from the toolbar), and click over any point in the image. You
can see the RGB values of the pixel at location (X,Y).
A better option of data cursor is the function imtool(). Type the following
>>imtool(‘peppers.png’);And see the pixel info on lower left corner as you move mouse pointer over different pixels.
Now, before we move on to our next article, we take a little detour in this article and talk about some MATLAB resources which will be extensively be used in coming article.
Making M Files & Functions in MATLAB
It is a provision in MATLAB where you
can execute multiple commands using a single statement. Here the group
of commands is stored as a MATLAB file (extension .m).
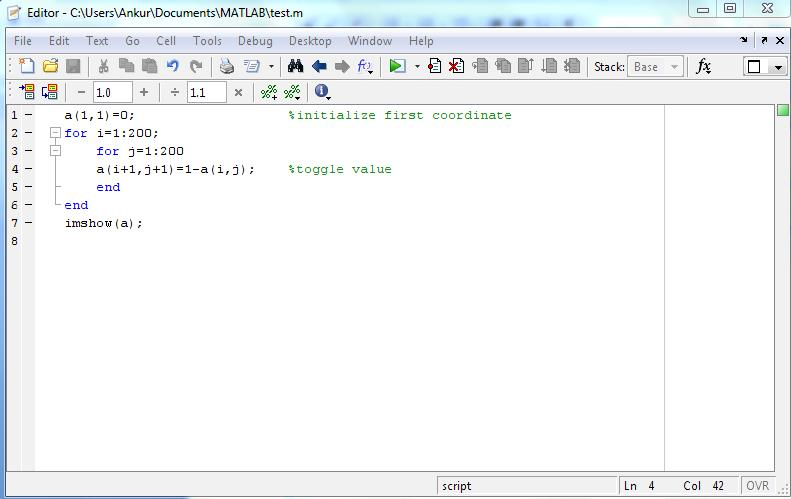
Here we have saved the m-file by the name “test.m”. Now as you type
>>testAnd in MATLAB command window, all the above commands will execute.
Comments: As we have comments in C/C++/ Java using double slash (//), in MATLAB we use symbol %
to write comments, i.e., statements that are not considered
for execution. You can see comments in green in the snapshot above.
Functions in MATLAB
Functions, as some of you might
know, are written to organize the code efficiently and make
debugging easier. The set of statements within a function can be
executed as and when required by just calling it, thereby avoiding
repetitions. The data which is needed within the function can be passed
as arguments and then the required values can be returned. You can
return any no. of values and they can be matrices also.
We value your suggestions and feedback very much. Please drop by your comments. This encourages us to move forward!Until next article is up this all folks! Keep reading and keep learning.
Electronics Lab Created By Muhammad Irfan


No comments:
Post a Comment